Learn How - Scheduled Trace Reporting
1. Be sure you've installed SQL-Hero server components. The document to consult on this one can be found here.
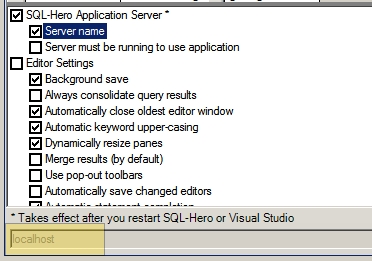
Double check that you have a server name specified on the Settings tool:
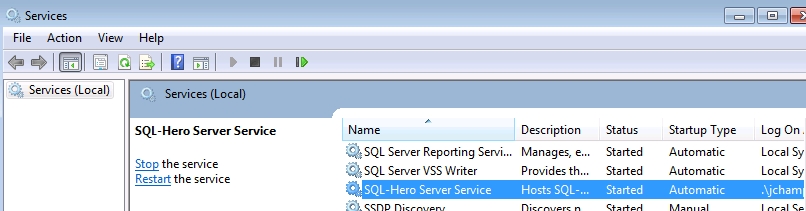
Also be sure the SQL-Hero Windows Service is running:
Furthermore, this assumes you've previously set up some global connections as described here.
2. Here we've elected to use a SQL Profiler trace, but it could also be initiated within SQL-Hero, or launched automatically as part of SQL Server startup. Let's assume we're going to record all events for now, although in practice, you'll probably
want to filter for errors or long running calls in anything resembling production.
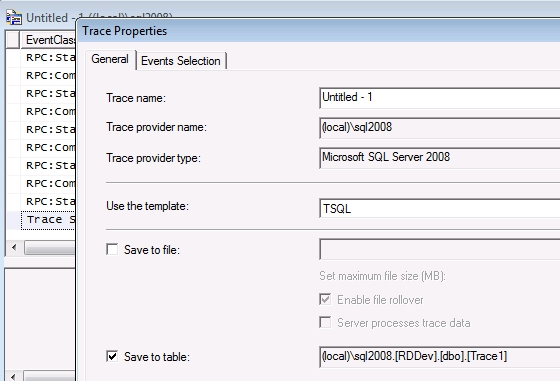
We're going to store the trace results in a table called "Table1" in the "RDDev" database.
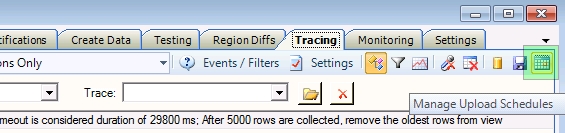
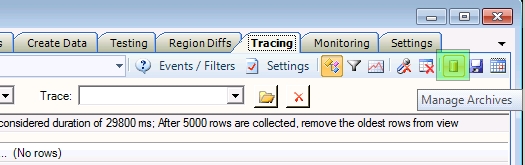
3. In order to collect this information into SQL-Hero, on the Tracing tool, use the Manage Upload Schedules option:
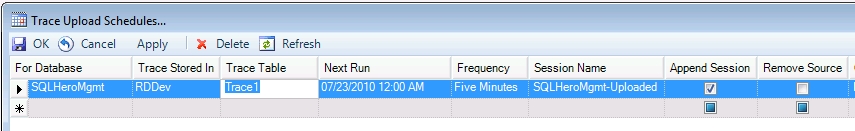
Here we have set it up so that we're interested in events for the SQLHeroMgmt database specifically (plus, we set up a global connection called SQLHeroMgmt to point at this database). The trace table itself is stored in RDDev and is caled Trace1.
With a frequency of five minutes, we're going to get very current updates, but not real-time. We've given this uploading process a unique name which can be used in the trace manager for searches.
We're electing to append to this session as new events arrive, and we've unchecked the "Remove Source" checkbox which means we'll leave the trace records in the Trace1 table.
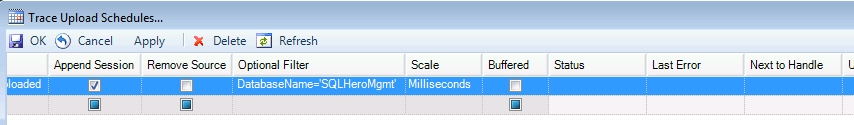
The optional filter in this case is letting us restrict captured events to a specific database by name. Note that the filter string relates to the fields we're chosen to capture in Table1.
The scale field is useful since some versions of SQL Server capture durations in microseconds - specify the correct duration scale here.
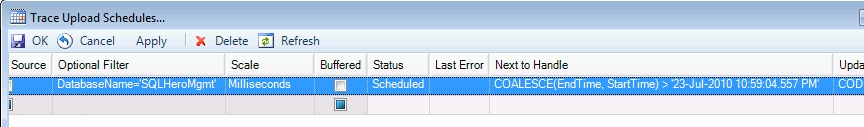
After we've applied these changes and waited a few seconds and refreshed the screen, notice that the status is "Scheduled" and the "Next to Handle" field shows that some records have indeed been captured.
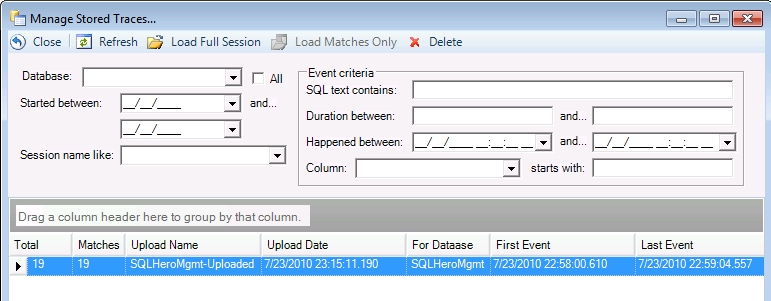
This is verified if we go to the "Manage Archives" option:
After refreshing, we can see that 19 events were actually captured - so far:
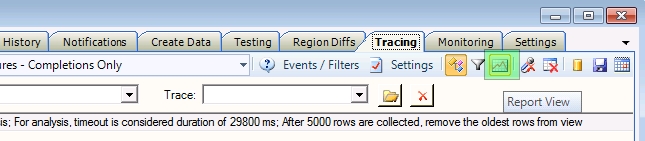
4. With trace information in the repository, let's schedule some reports to run against it. First, switch to the Report View:
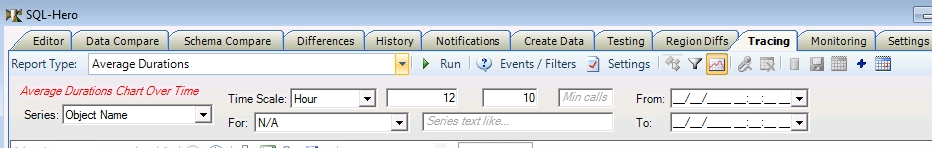
5. Next, pick the report type you want, providing the desired parameters:
6. Now you can click on the "Add Report to Schedule":
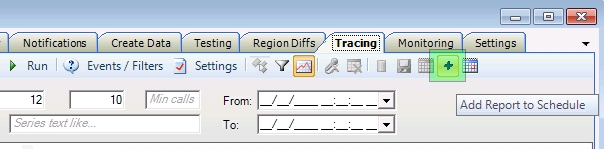
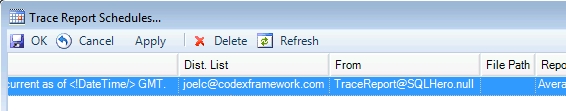
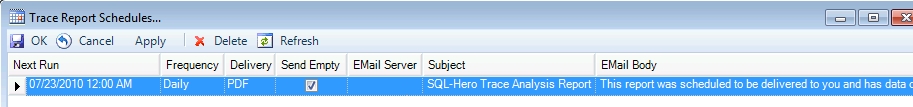
This brings up the schedule window with the report ready to commit - but you need to fill in a few details such as the time to run it next, how often it should run, and whether the report should still be sent if there's no data to show. The default delivery type is as a PDF attachment, although you can elect to deliver it as a file link.
You're required to provide your SMTP mail server name here as well. You can also customize the email subject and body. Some substitution tags are also available as documented here.
The remaining fields you can customize include the distribution list for the report (comma separated), the name to use as the sender, and the file location if sending as a file link.